Adhoc Reports Chart
- The main purpose of ad-hoc reporting is to give more power to end-users in retrieving and analyzing the business data. Chart widget will enable users to create customized charts using their own data to create insightful visualizations.
Objective
- Create Adhoc Report using Chart
Prerequisite
- Used Sales.cds for this example.
Download adhoc_analysis.zip file from link given adhoc_analysis.zip.
- After downloading the zip file, add the Sales.cds into the Dataset Section of AIV for this example. To add it into AIV follow this Link.
Adhoc - Report Chart: This video contains information regarding How to Create Adhoc Report using Chart in AIV.
Steps to Create Adhoc Report using Chart
Login to AIV using your credentials.
Go to Hamburger
 icon > Documents > Adhoc Report
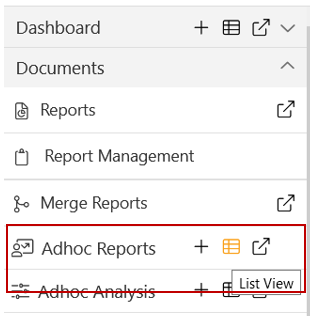
There are two ways in which a user can Create Adhoc Report.
I. Clicking on Adhoc Report located at the bottom-most toolbar.
![]()
II. By right-clicking the any existing user can also create Adhoc Report.

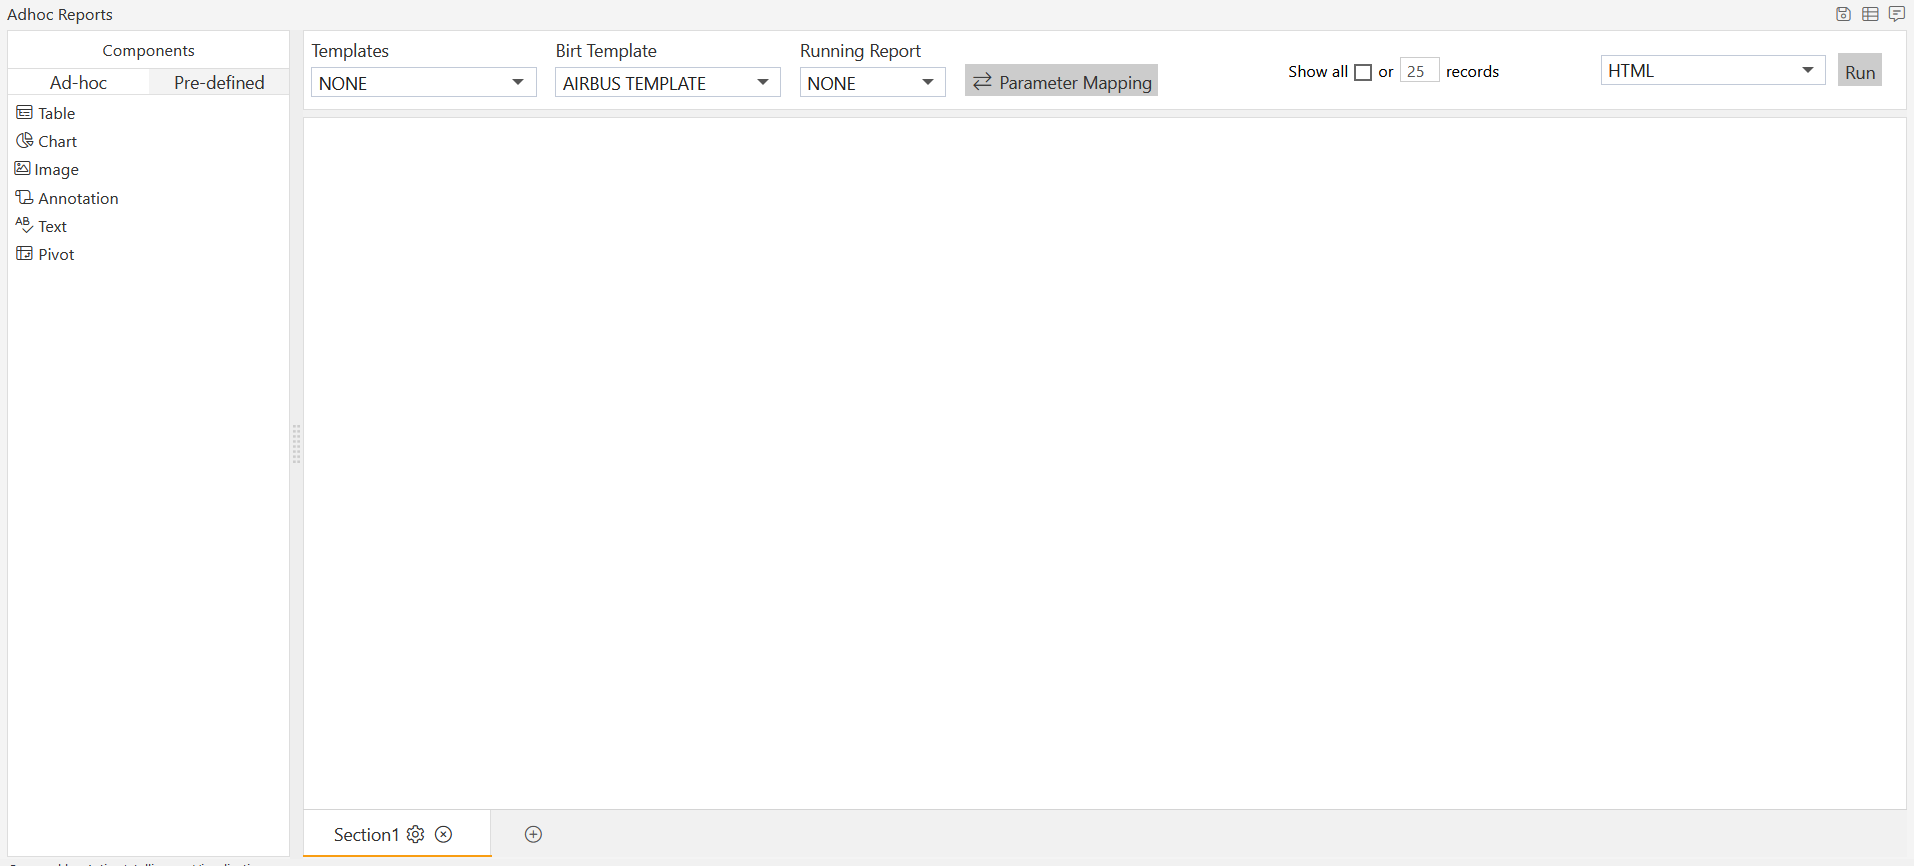
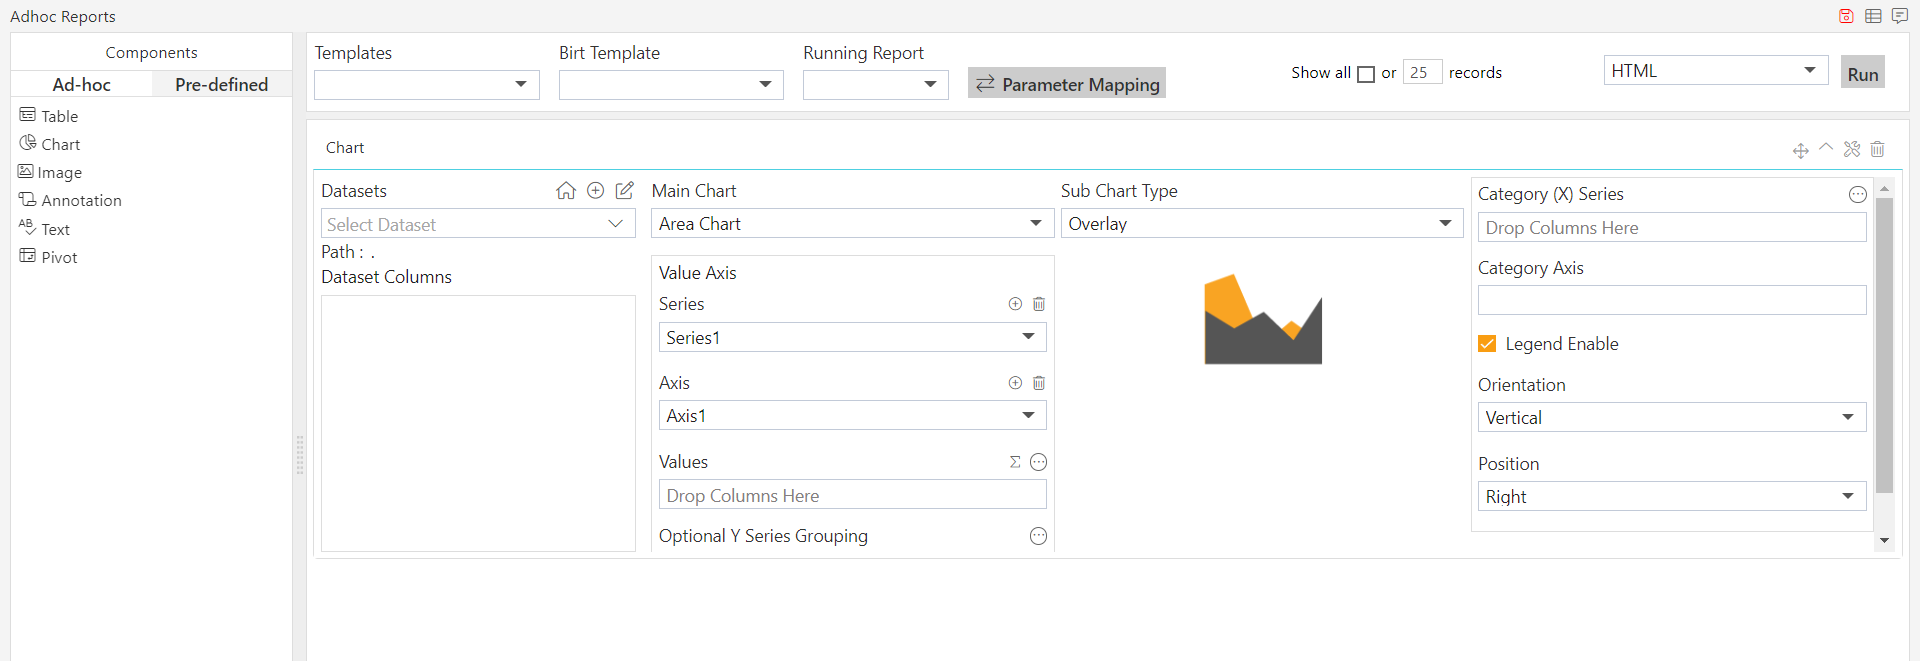
On clicking the Create Adhoc option, from one of the methods mentioned above user will see the window as below:
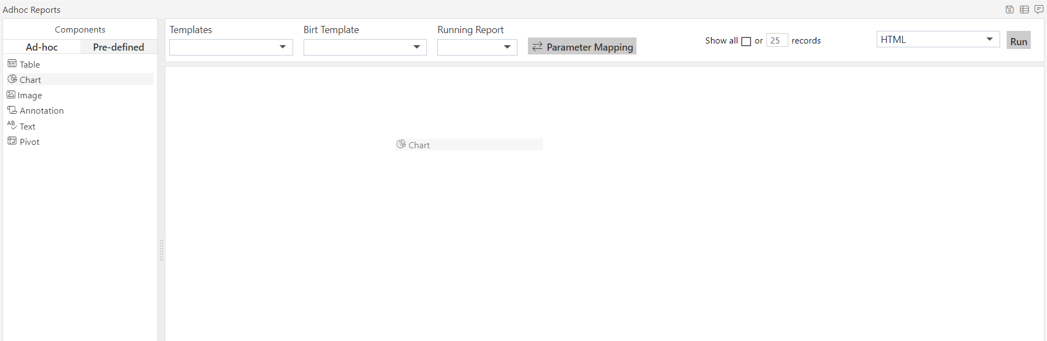
Drag & Drop Chart component to the empty area as shown below:
If user wants to add two or more components in report, then they can drop another component in the empty area below the first component as shown below:
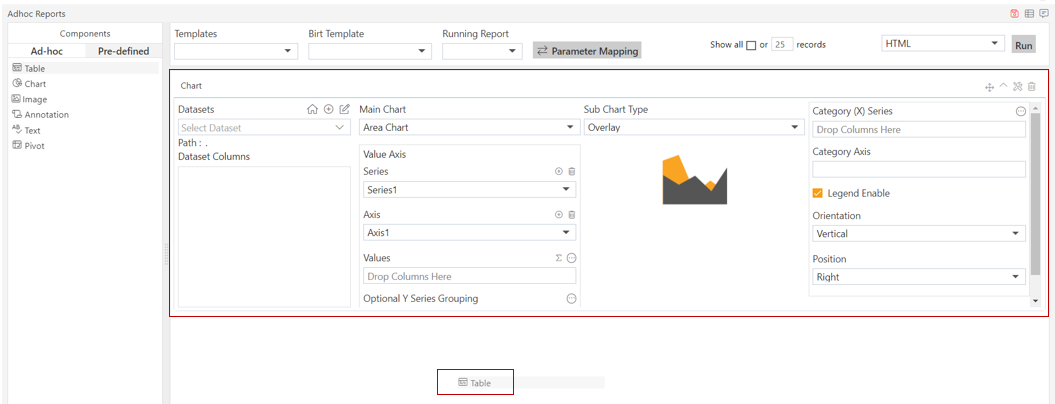
As user perform the above step, window will look as per the image below:
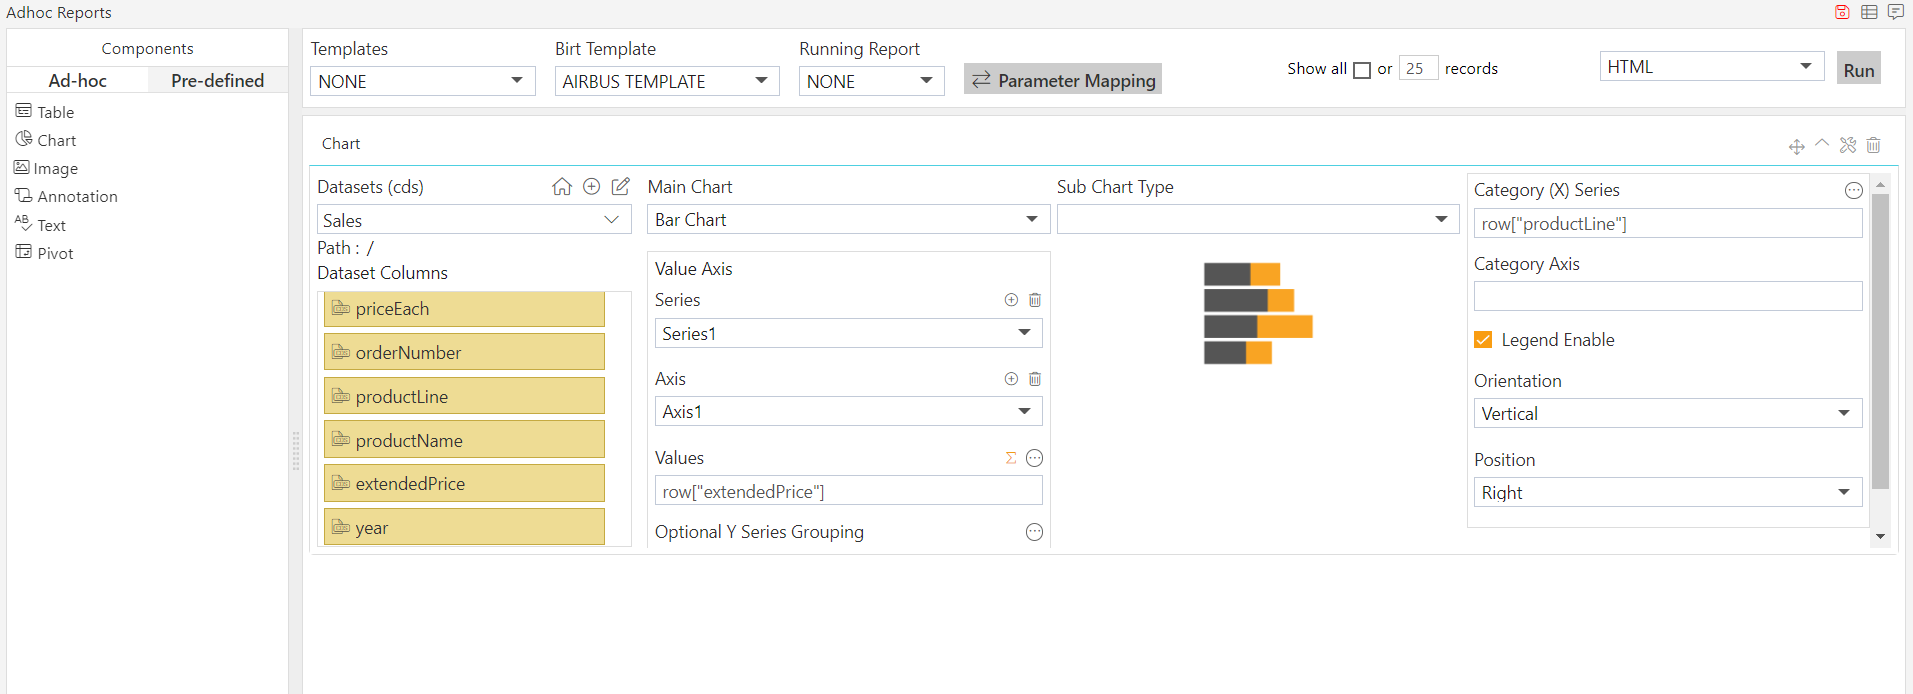
Now from the drop-down list of Datasets select the Sales.cds as follows:-
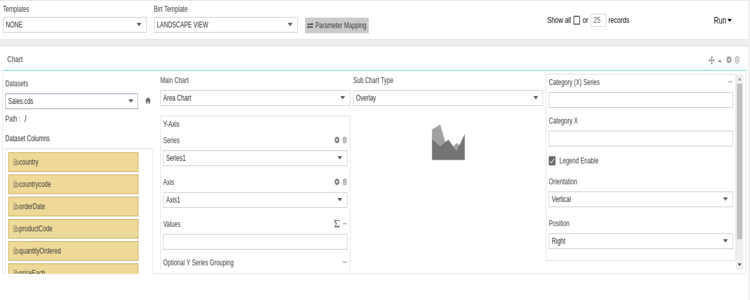
You will see all the columns of the Dataset under Dataset Columns.
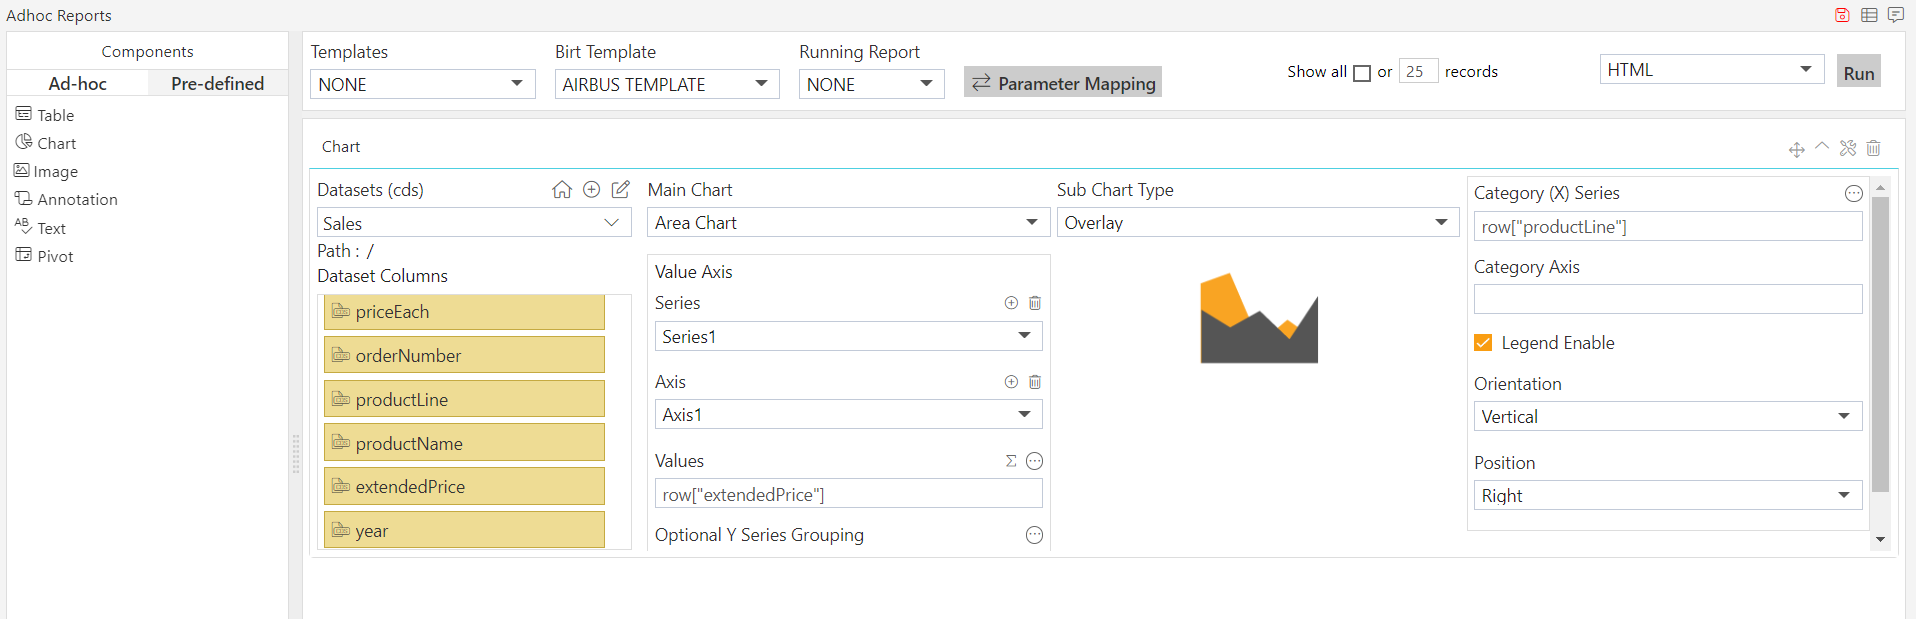
Now drag and drop productLine in Category (X) Series and extendedPrice to Values as shown below:
Click on the
 icon at right next to Values below dialog box will appear:
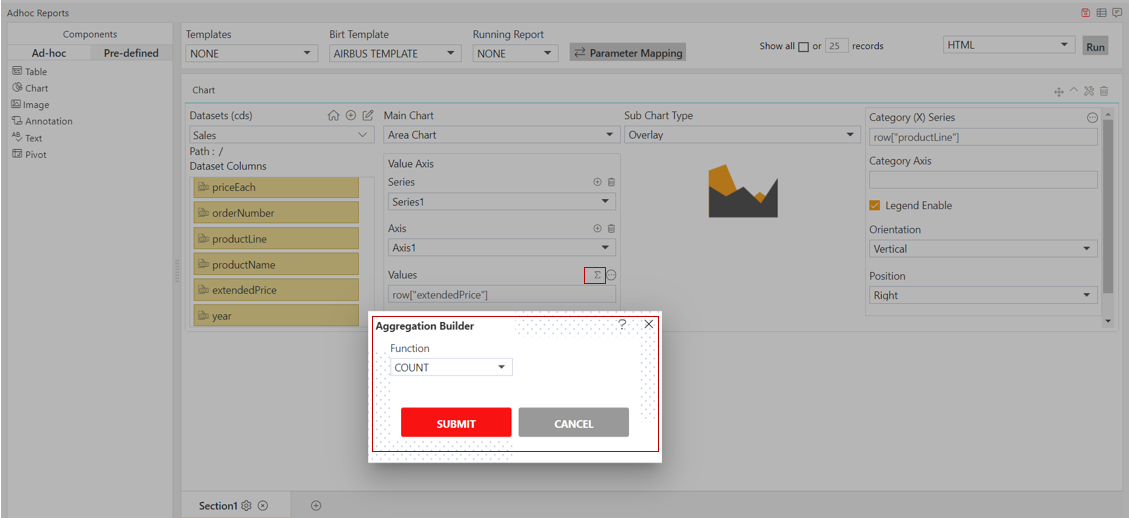
Click on SUM from the Function drop-down & Click on Submit button.
Select Bar Chart from the Main Chart drop-down as below:
Select LANDSCAPE VIEW from the Birt Template drop-down as shown.
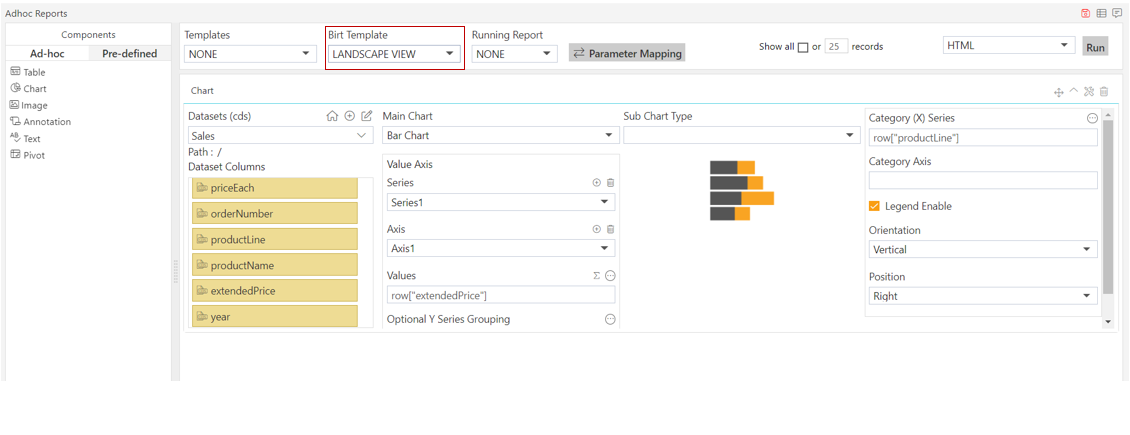
You can also specify the number of records you want to show on a page from the following widget near the template selector widget:-

User can select format in which they want to run the report from the drop-down near to RUN option.
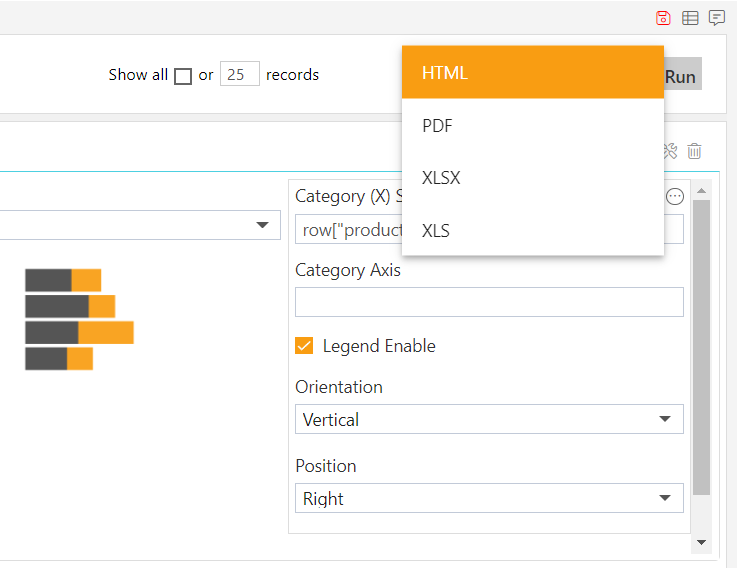
For this example, we select Run as HTML.
To run the Adhoc Report using Table Component, click on Run in the top most right corner as follows:-

Click on RUN option, which will open the following dialog box:-
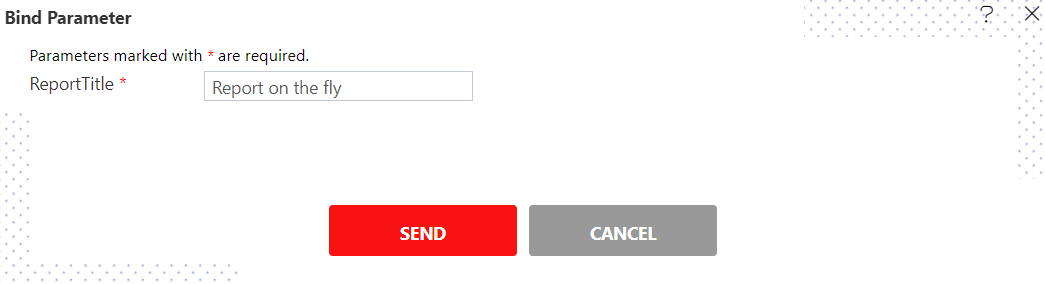
As the table has no parameters, just click on SEND button & it will redirect you to another screen of the browser.
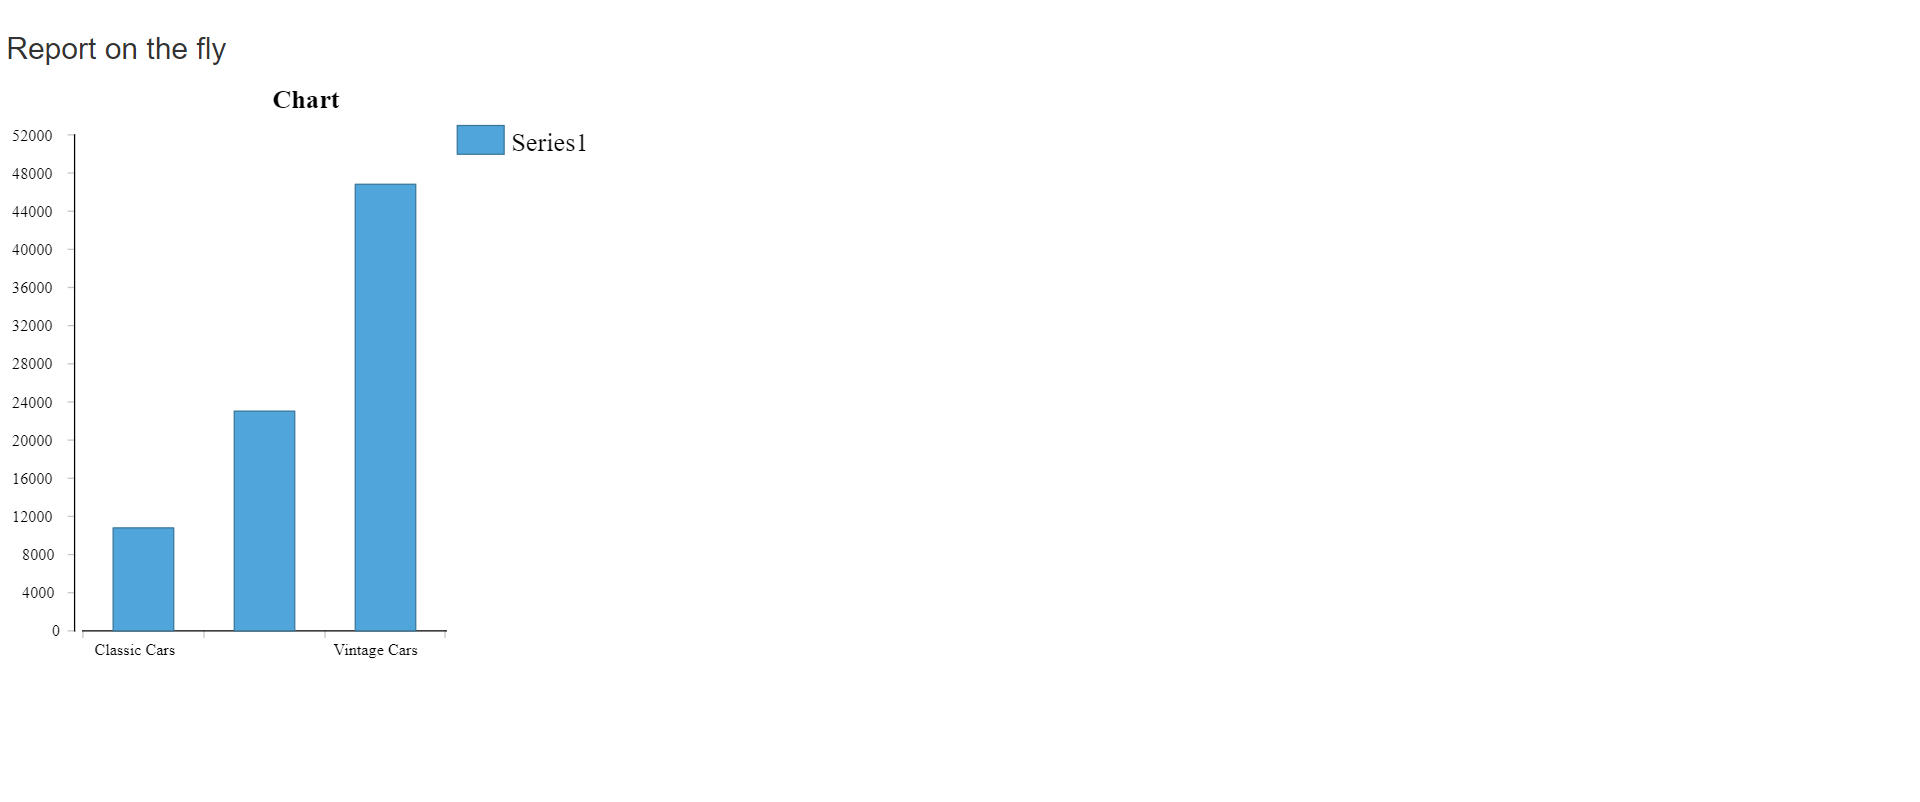
The Adhoc Report using Chart component will be generated in HTML.
If you want to save your report you can click on the Save
 button at the topmost right corner below admin which will open the following dialog box:-
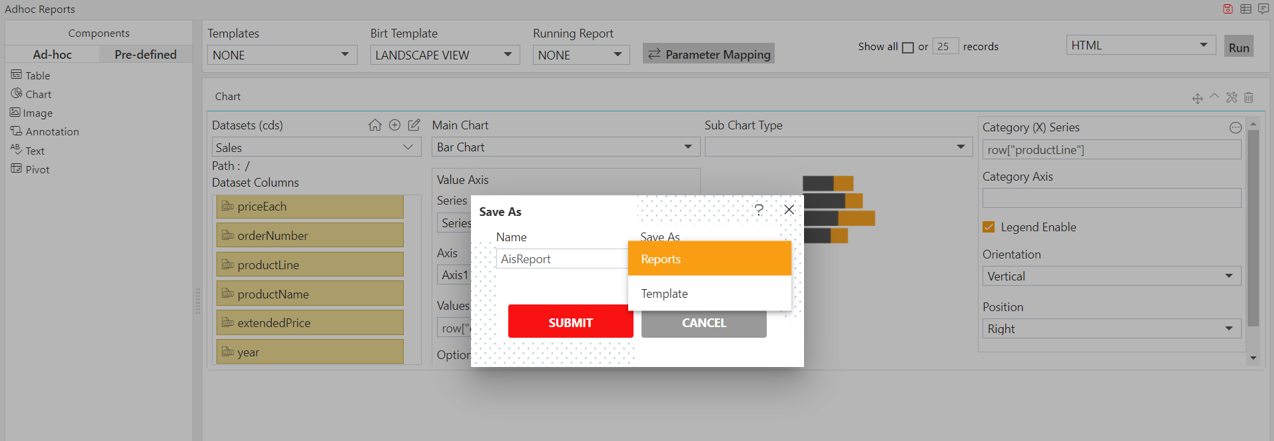
You can give your own Name in the selected column, and select Save As a Report / Template.
For this example; give Name: Adhoc Chart & Select Save As: Report and click on submit button to perform the save operation.
If you want to change the settings of a widget click on
 below Run which will open the following dialog box:-
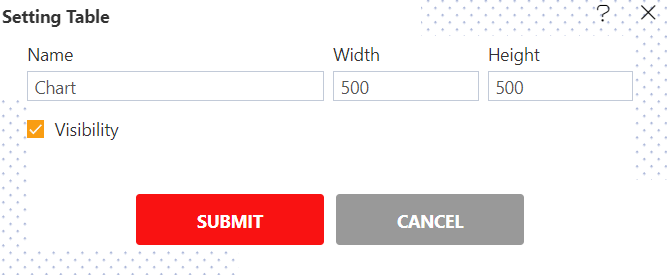
Here you can change the Name, Width, Height, Visibility and Page Break of your table & click on Submit button to save the changes.
Similarly press
 in order to delete the chart widget.
✒️ To know more abour Adhoc Reports features follow below Links:-